Music Visualizer
A music visualizer is animated graphics that move to the sound: jumping spectrum bars, a pulsing ring, a waveform line and more. It turns a song with a still picture into a lively music video, and adds energy to a podcast or a lyric video. In Bolide Movie Creator the visualizer is a separate block on the timeline that "listens" to the audio of the clips below it.
Where to find the visualizers
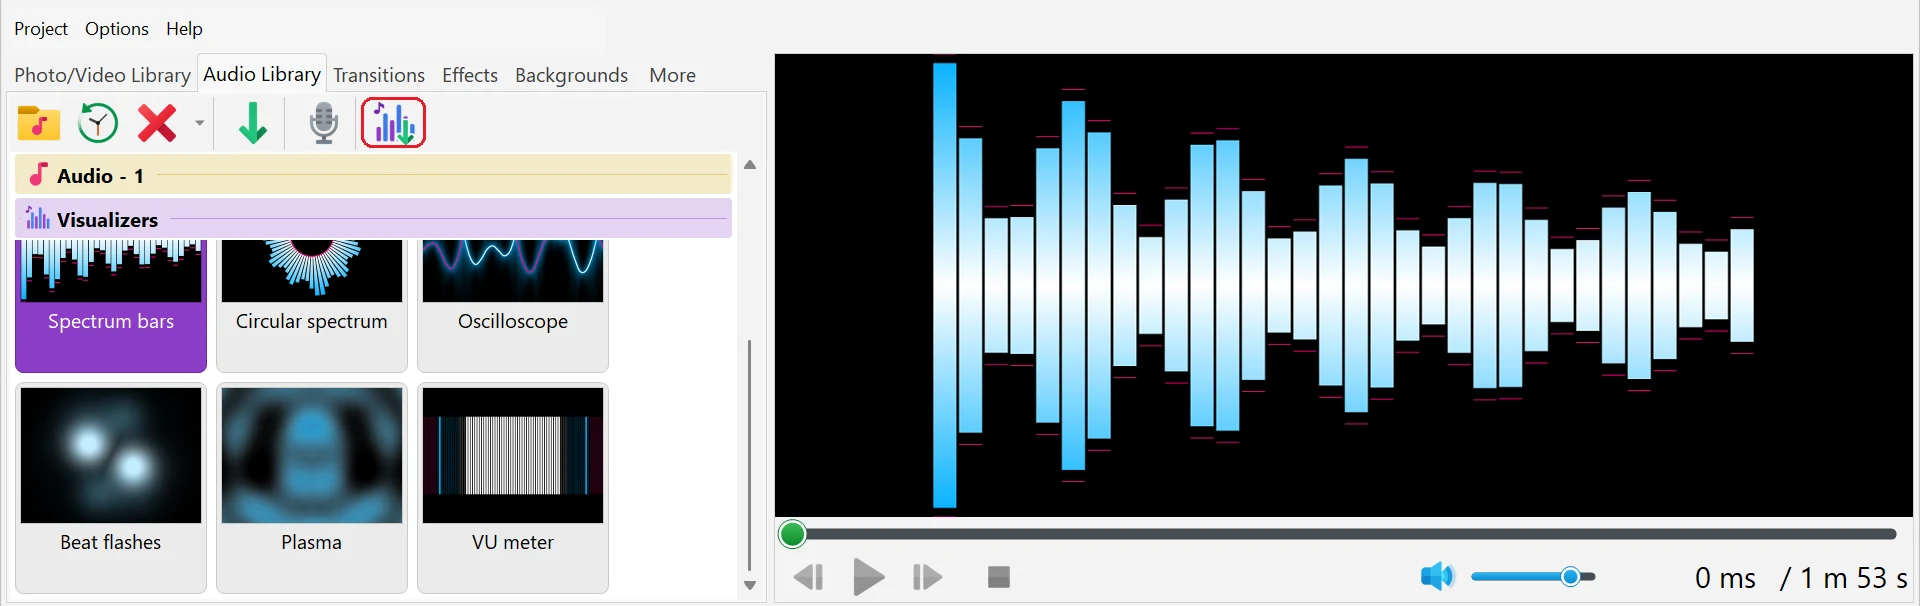
- Open the Audio Library tab. Below your audio files there is the Visualizers group with six styles: Spectrum bars, Circular spectrum, Oscilloscope, Beat flashes, Plasma and VU meter. Click a group header to jump to the beginning of that group.
-
Click a style tile to see a still sample frame of it in the preview window. Tiles can be put in any order by dragging them within the group.
Add a visualizer to the project
-
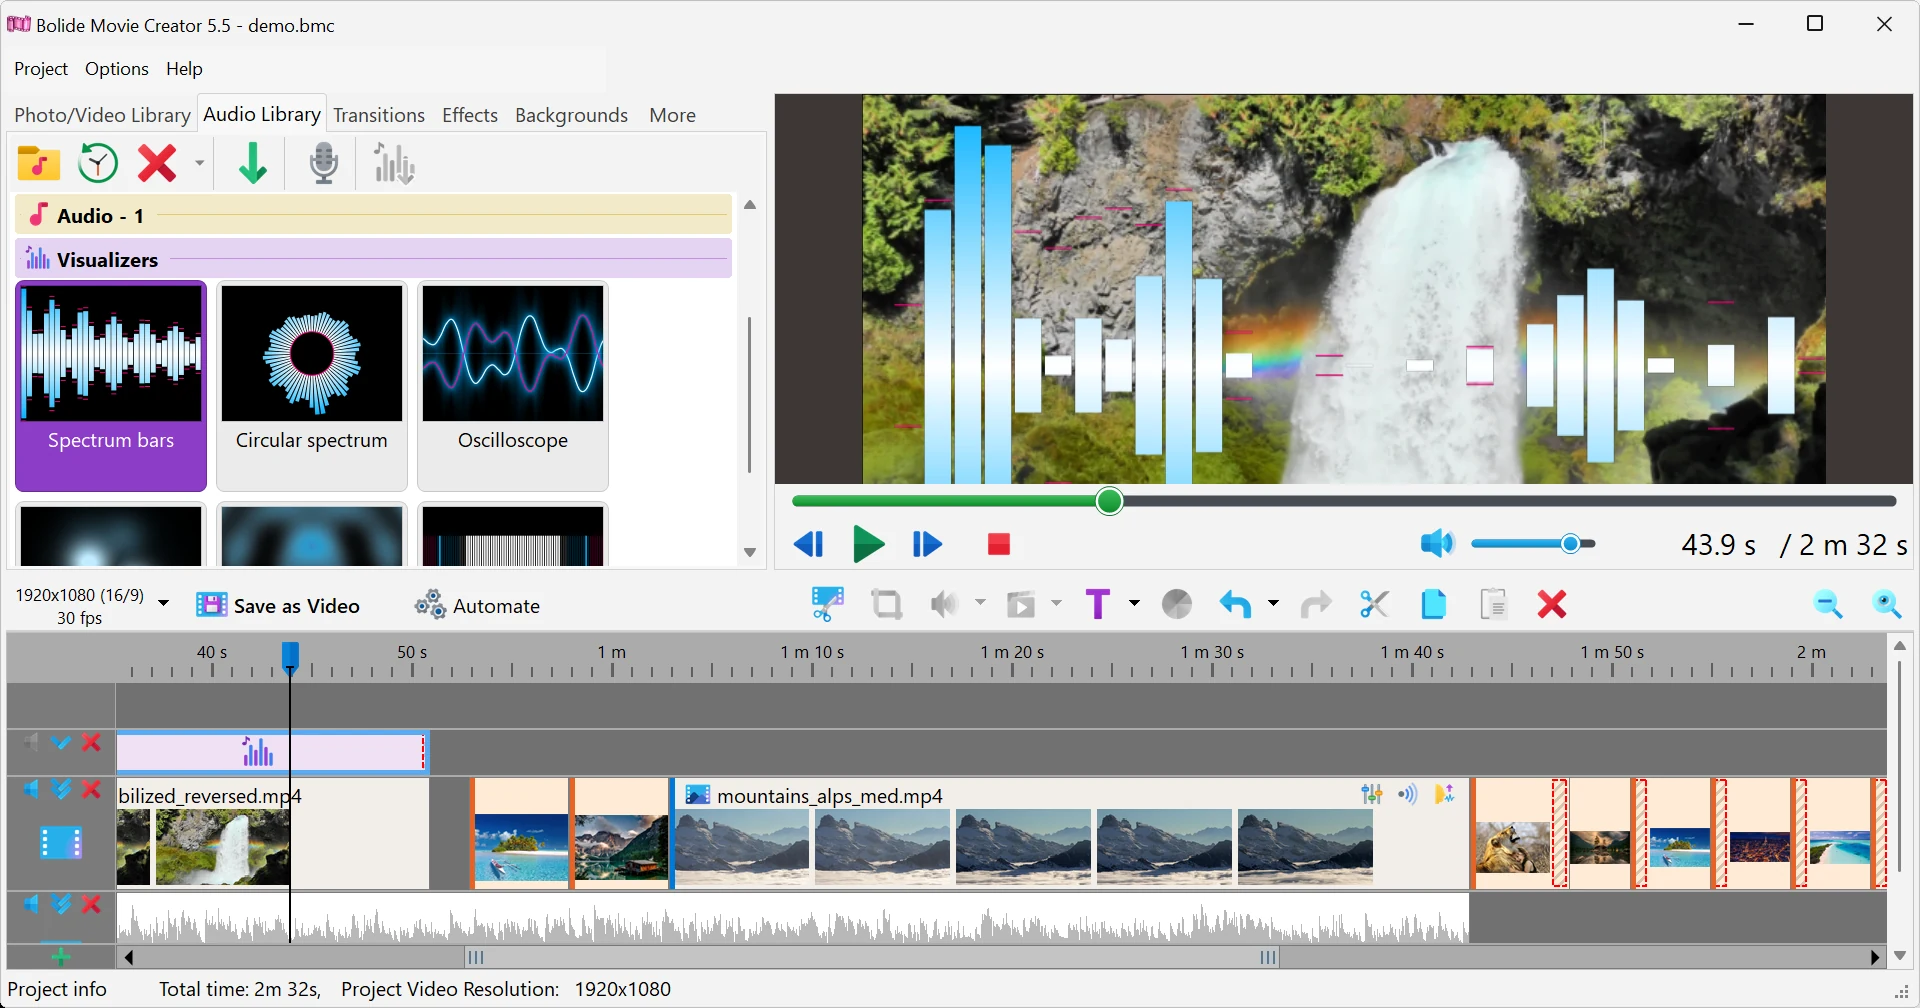
The quickest way is to drag a style tile onto the timeline:
- drop it on a clip — the visualizer is placed on the track right above that clip, with the same start and length;
- drop it on an existing visualizer — that visualizer gets the new style and its settings (the audio source stays the same);
- drop it on an empty place of a track — a 5-second visualizer is created there; drop it below the lowest track to create a new track for it.
- Or select a clip on the timeline, select a style tile and click Add music visualizer on the toolbar of the Audio Library tab. The same command is in the right-click menu of a style tile and in the Audio operations menu on the timeline toolbar; it uses the style selected in the Visualizers group (Spectrum bars if none is selected). If no clip is selected, the visualizer is added in the middle of the visible part of the timeline. After adding this way, the settings window opens at once; Cancel removes the new block.
-
A new visualizer covers the whole frame and smoothly appears and fades out (0.5 seconds at each end). It is a regular block: drag it along the timeline and drag its edges to change the length.
The visualizer settings window
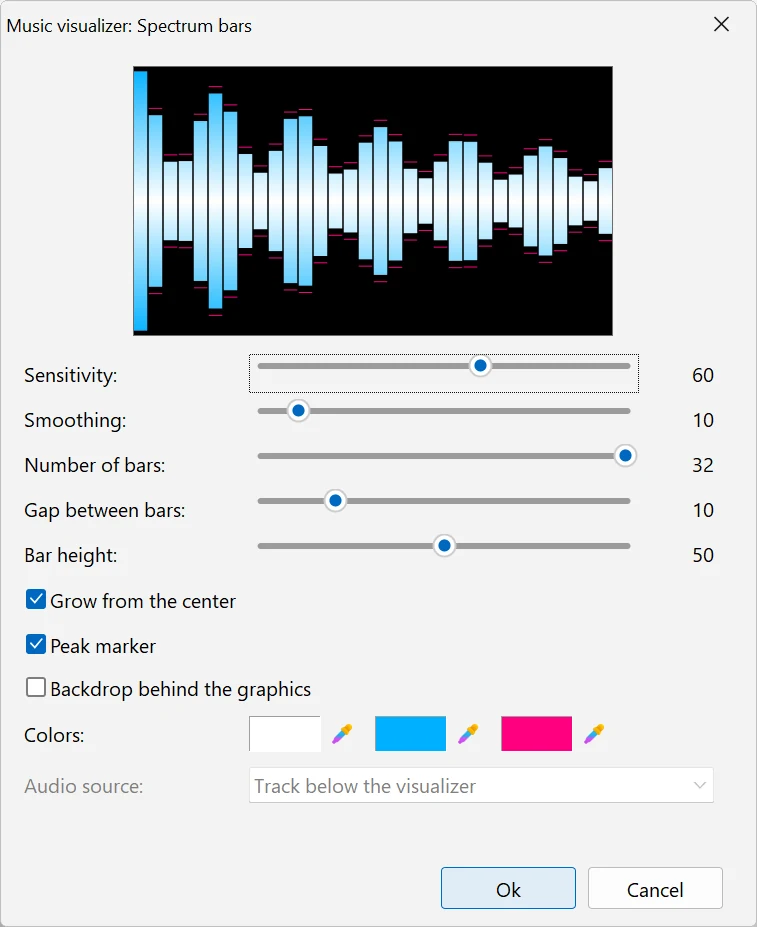
- Double-click the visualizer block, or right-click it and choose Visualizer settings.... The window title shows the style, for example Music visualizer: Spectrum bars; at the top there is a sample of how the style looks with the current settings. The style itself is not changed here — to switch to another style, drop another tile on the block.
- Sensitivity — 0 to 100, 60 by default. How strongly the graphics react to the sound: raise it for quiet music, lower it if the graphics are always "at the top".
- Smoothing — 0 to 100, 10 by default. How long peaks are held before they fall back (up to 0.3 s): higher values give calmer, smoother motion.
- Below are the settings of the current style (see the list below), then Backdrop behind the graphics — a semi-transparent dark background under the graphics, useful over a bright or busy video.
- Colors — three color samples. Click a sample to choose a color, or hold the mouse button on the eyedropper button next to it and point at any place on the screen: the color under the cursor is picked when you release the button. What each color is used for depends on the style.
-
Audio source — which sound the visualizer follows:
- Track below the visualizer (default) — the track directly under the visualizer's track;
- All tracks below — the sound of all tracks under it together;
- Track N: name — a particular track of the project (the name of the first clip with sound on it is shown). The link is kept even if you move tracks around.
- If the message No sound under the visualizer: place it above a clip with audio or choose another audio source appears under the source, the visualizer has nothing to react to — move it above a clip with sound or choose another source. Analyzing the sound... means the program is still preparing the audio; wait a moment.
- Places where there is no sound under the visualizer are hatched on its block on the timeline; hover the mouse over such a place to see the reason. By default the graphics are not drawn there. Tick Always show, even where there is no audio data to keep them on screen all the time, at rest: for example, as a design element over a pause or over a video without sound.
-
Changes are shown in the main preview as you move the sliders. Ok (or Enter) keeps them, Cancel (or Esc) returns the block to its previous state. If you close the window with the X button after making changes, the program asks Apply the changes to the visualizer?
Styles and their settings
- Spectrum bars — columns for low to high frequencies. Number of bars 8–32 (32), Gap between bars 0–50 (10), Bar height 0–100 (50), Grow from the center (on) — bars grow up and down from the middle line, Peak marker (on) — a short line that marks the recent peak. Colors: the bar goes from Color 1 at the base to Color 2 at the top, Color 3 is the peak marker.
- Circular spectrum — rays around a ring. Radius 10–100 (50), Thickness 0–100 (50) of the rays, Rotation speed 0–100 (20; 0 — the ring doesn't rotate), Symmetric (on) — the left and right halves mirror each other. Colors: rays go from Color 1 to Color 2, Color 3 is the ring and the peak marks.
- Oscilloscope — a line that follows the sound wave. Amplitude 0–100 (50), Thickness 0–100 (50), Glow 0–100 (50), Double line (on) — adds a second, mirrored line. Colors: Color 1 is the line, Color 2 the glow, Color 3 the second line.
- Beat flashes — bright spots that flash on the beats. Spot size 0–100 (50), Fade time, ms 100–800 (300), Symmetric (on) — each spot gets a mirrored twin, Flash on beat (on) — the whole area lights up slightly on a strong beat. Colors: spots are tinted between Color 1 and Color 2, Color 3 is the flash of the whole area.
- Plasma — a flowing color pattern that pulses with the music. Pattern density 0–100 (50), Speed 0–100 (50), Kaleidoscope (on) — a mirrored pattern. Colors: the pattern blends Color 1 and Color 2, Color 3 is used for the brightest places.
- VU meter — a segmented loudness indicator. Number of segments 10–60 (40), Thickness 0–100 (50), Vertical scale (off) — the scale runs along the height of the area, Stereo (grow from the center) (on). Colors: Color 1 for the normal level, Color 2 for loud, Color 3 for the loudest part of the scale.
Change the default settings of a style
- Double-click a style tile in the Visualizers group (or select it and press Enter, or right-click it and choose Visualizer settings...). The same settings window opens, but without the audio source.
- After Ok the tile shows the new look, and every visualizer you add with this tile from now on starts with these settings. Visualizers already in the project don't change.
Good to know
- When the visualizer block is selected, its area is shown with a frame in the preview window. Drag the frame to move the graphics and drag its markers to resize them — for example, to put narrow bars along the bottom of the frame. The area may go partly beyond the edge of the frame, so you can show, for example, only the upper half of a circular spectrum.
- The right-click menu of the block also has Start/End Effects (how the visualizer appears and fades out — see Add Fading for Video Clips), Transparency (see Change Video Transparency) and Delete.
- The visualizer only shows the sound, it doesn't play it. The clip with the audio must stay in the project (you can lower its volume if you only want the picture).
- The graphics depend only on the sound at each moment, so the preview and the saved video look exactly the same. To save the result, click Save as Video.
Related topics
- Add Audio to Audio Library
- Adjusting Audio Levels in Your Video
- Working with Tracks and the Timeline
- Change Video Transparency
- Backgrounds: Color, Gradient and SVG Elements
- Video Effects
Back to Video Editing Guide.